
Last updated: September 2026 | Reading time: ~14 minutes
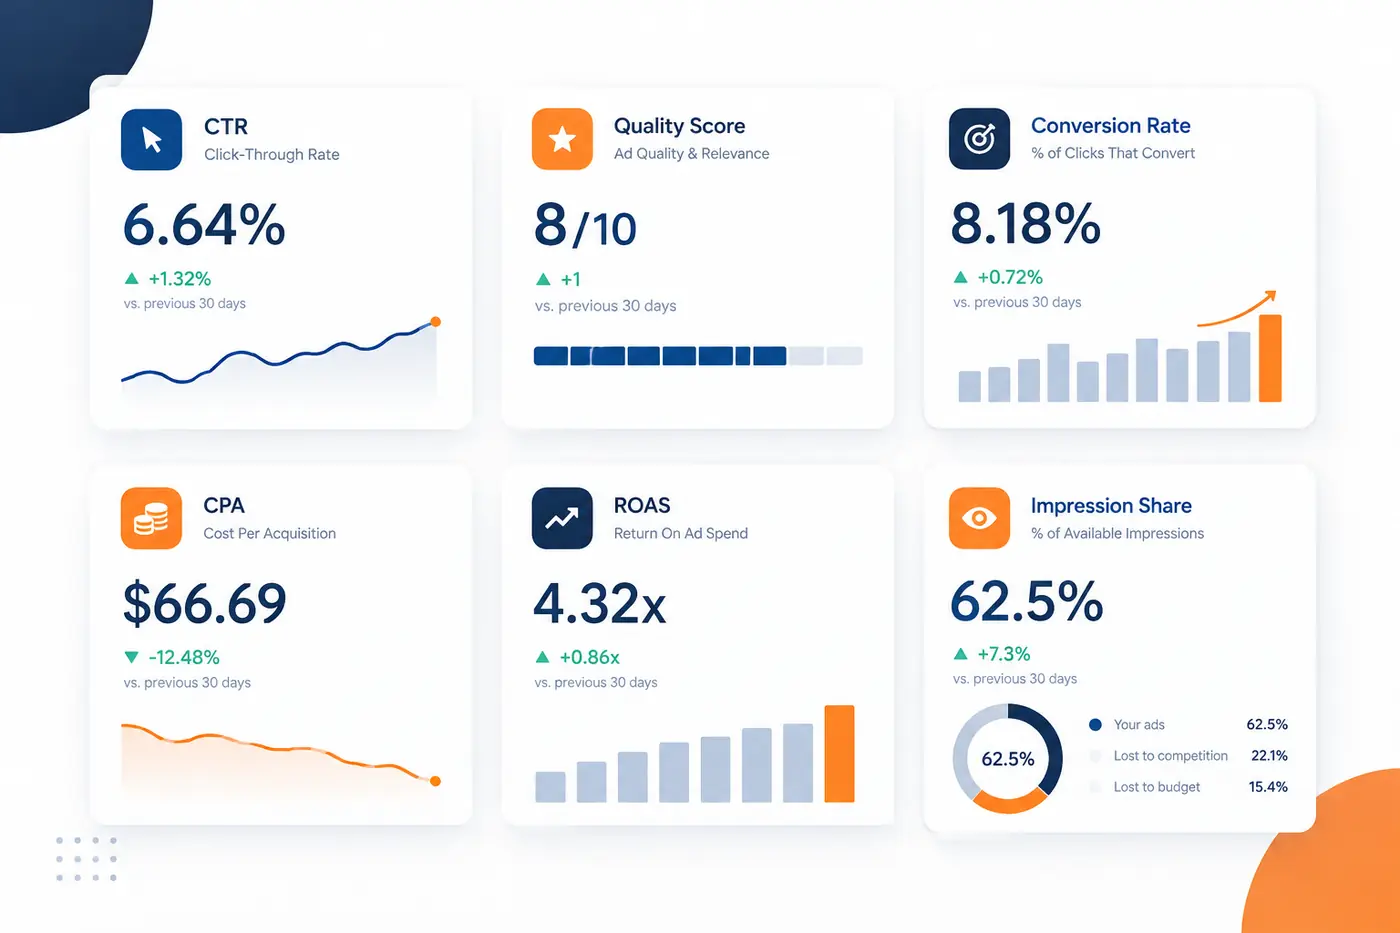
Quick answer: PPC campaign metrics are the data points that show whether your paid campaigns are working — grouped into five categories: volume (impressions, CTR, impression share), cost (CPC, CPM, spend), quality (Quality Score and its components), conversion (conversion rate, CPA, ROAS), and competitive (auction insights). The six metrics that matter most for almost every account are CTR, Quality Score, Conversion Rate, CPA, ROAS, and Impression Share.
Key takeaways:
- Which metrics matter most depends on your campaign objective — awareness campaigns and conversion campaigns are judged on different numbers (see below)
- Start diagnosis with Conversion and Revenue metrics; they tell you if the campaign is profitable. Everything else explains why
- A Quality Score of 8–10 can cut your effective CPC by 30–50% versus a score of 3–4 on the same keyword
- Low Impression Share has exactly two causes — budget or rank — and Google tells you which one directly
- 2026 industry averages (Search): 6.64% CTR, $5.42 CPC, 8.18% conversion rate, $66.69 cost per lead — sourced from WordStream/LocaliQ’s 2026 Google Ads Benchmarks report
Open any Google Ads account and you will find over 150 columns available in the reporting dashboard. Most of them are noise. A handful of them — if you know what they mean and when to act on them — are the difference between a campaign that drains budget and one that compounds into a reliable revenue channel.
This guide covers every PPC campaign metric that actually matters. For each one, you will find the formula, what good looks like, and the specific action to take when something is wrong.
In This Guide
- Which metrics matter for your campaign objective
- What are PPC campaign metrics and why do most businesses track the wrong ones?
- Volume and visibility metrics
- Cost and spend metrics
- Quality and relevance metrics
- Conversion and revenue metrics
- Competitive and auction metrics
- Advanced metrics for scaling campaigns
- Quick reference table
- Frequently asked questions
Which PPC Campaign Metrics Matter for Your Objective
Before diving into individual metrics, match them to what the campaign is actually for — this is the single biggest reason accounts track the wrong numbers.
| Campaign Objective | Primary Metrics | Secondary Metrics |
|---|---|---|
| Awareness (Display, YouTube, Demand Gen) | Impressions, Reach, Frequency, CPM | View-through conversions, Ad Recall |
| Consideration (traffic, engagement) | Clicks, CTR, CPC | Bounce rate, Time on site |
| Conversion (Search, Shopping, lead gen) | Conversions, Conversion Rate, CPA, ROAS | Quality Score, Impression Share |
A campaign built for awareness that gets judged on CPA will always look like it’s failing — it was never optimizing for that outcome. Matching the metric to the objective is the first decision, before any benchmark matters.
What Are PPC Campaign Metrics and Why Do Most Businesses Track the Wrong Ones?

PPC campaign metrics are the data points the platform uses to report on how your campaigns, ad groups, keywords, and individual ads are performing. They fall into five meaningful categories: volume, cost, quality, conversion, and competitive. Each category tells a different part of the story. Ignoring any one of them creates a blind spot that costs money.
The mistake most businesses make is tracking metrics that are easy to see — impressions, clicks, website sessions — rather than metrics that connect directly to business outcomes. Impressions tell you how many times your ad appeared. Revenue tells you whether that appearance was worth anything. The gap between those two numbers is where most Google Ads budgets disappear.
The second mistake is reading metrics in isolation. A 10% CTR looks excellent until you check the Conversion Rate and find that only 0.3% of those clicks converted. A low CPC looks efficient until you discover the keywords driving cheap clicks have zero commercial intent. Metrics only tell the truth when they are read together.

This is central to how we structure campaign reporting at Harmukh Technologies. As part of our performance marketing campaign setup process, every client dashboard surfaces only the metrics with direct decision-making value — and connects each one to a business outcome. This guide is the framework behind that dashboard. Once you’ve got the metrics down, see how we turn them into client-ready and internal PPC reports — the reporting cadence and formats built on top of everything below.
Types of PPC Campaign Metrics
PPC campaign metrics fall into five categories: volume, cost, quality, conversion, and competitive. Each answers a different question about your campaigns, and a sixth group of advanced metrics helps once the basics are stable. The sections below cover each one, with the formula, what good looks like, and what to do when the number moves.
Volume and Visibility Metrics — Are Enough People Seeing Your Ads?
Volume metrics tell you whether your campaigns are reaching a meaningful audience in the first place. A campaign can be structurally excellent and still fail because bids, budget, or targeting are preventing it from entering auctions at sufficient scale. These are always the first metrics to check when a campaign is underperforming.
Impressions
What it is: The number of times your ad appeared on Google’s network — Search, Display, YouTube, Shopping, or Partner sites. Formula: Platform-reported count of ad displays. What good looks like: Growing week-on-week for any campaign with sufficient budget and competitive bids. When to act: If impressions drop sharply without explanation, check for ad disapprovals, budget caps, and bid floors before assuming a broader platform issue.
Clicks
What it is: The number of times users clicked your ad and landed on your destination URL. Google filters invalid clicks before billing. Formula: Platform-reported count of valid clicks. What good looks like: Proportional to your impression volume given your CTR benchmark. When to act: High impressions with low clicks means your headlines, offer, or extensions are not compelling the click. Test new headline angles before adjusting bids.
Click-Through Rate (CTR)
What it is: The percentage of people who saw your ad and chose to click it — your real-world ad relevance signal, and a significant input into Quality Score. Formula: (Clicks ÷ Impressions) × 100 What good looks like: The average Search Network CTR across industries in 2026 is 6.64%, per WordStream/LocaliQ’s 2026 Google Ads Benchmarks report (13,474 US search campaigns, April 2025–March 2026). By industry, this ranges from 5.56% (Automotive Repair) up to 12.75% (Arts & Entertainment) — always compare against your specific vertical, not the blended average. Branded campaigns typically run well above their category average. Display Ads sit far lower: 0.35%–0.5% is considered strong, since Display is a passive-browsing format. When to act: A Search CTR meaningfully below your industry’s benchmark almost always indicates a headline-to-keyword mismatch. Rewrite top headlines to include the exact search term and lead with a specific benefit or number.
Impression Share
What it is: The percentage of total eligible impressions your ads actually received. If your Impression Share is 60%, your ads showed in 60 out of every 100 auctions they qualified for. Formula: Impressions Received ÷ Total Eligible Impressions What good looks like: 80%+ for branded campaigns. 50%–70% is acceptable for competitive non-branded terms. When to act: Low Impression Share has two distinct causes — budget or rank — and Google tells you which directly through the Lost IS metrics below.
Search Impression Share Lost to Budget
What it is: The percentage of eligible impressions you missed because your daily budget ran out before the day ended. Formula: Reported directly by Google. What good looks like: Below 10%. Anything above 20% on a profitable campaign is a budget allocation problem, not a campaign problem. When to act: If Lost IS (Budget) is high on campaigns with positive ROAS, increase the daily budget or concentrate spend on your highest-performing ad groups.
Search Impression Share Lost to Rank
What it is: The percentage of eligible impressions you missed because your Ad Rank was not high enough. Ad Rank = bid × Quality Score. Formula: Reported directly by Google. What good looks like: Below 10%. High Lost IS (Rank) is a Quality Score problem first, a bidding problem second. When to act: Improving Quality Score before increasing bids is almost always the more efficient fix.
Cost and Spend Metrics — What Are You Actually Paying?
Cost metrics determine the economics of your campaigns. A campaign generating plenty of clicks can still be unprofitable if the cost per click, cost per conversion, or budget structure is misaligned with your margins.
Total Cost (Spend)
What it is: The total amount charged to your account for a campaign, ad group, or keyword over a selected period. Formula: Sum of all valid click charges in the period. What good looks like: Proportional to the revenue or leads generated. Always view alongside Conversions and ROAS. When to act: If cost is rising without a corresponding improvement in conversions or ROAS, isolate which segments are consuming budget without contributing outcomes.
Average Cost Per Click (CPC)
What it is: The average amount you pay each time someone clicks your ad. Formula: Total Cost ÷ Total Clicks What good looks like: The 2026 average Search CPC across industries is $5.42 (per WordStream/LocaliQ), roughly 2.3× what it was a decade ago ($2.32 in 2016) — a reflection of rising competition, not necessarily inefficiency. Industry CPC varies enormously: Restaurants & Food average $2.05, while Attorneys & Legal Services average $9.87. The right benchmark for your account is the CPC that still produces your target CPA given your conversion rate — a higher CPC funding a high-converting keyword can be more profitable than a lower CPC funding one that doesn’t convert. When to act: Rising CPC without a rising Conversion Rate is a profitability warning — check for increased competitor bids or a dropped Quality Score.
Cost Per 1,000 Impressions (CPM)
What it is: The cost of reaching 1,000 people — the primary efficiency metric for awareness-focused campaigns. Formula: (Total Cost ÷ Total Impressions) × 1,000 What good looks like: CPM varies heavily by platform (Display vs. YouTube vs. Demand Gen), audience targeting precision, and creative format — no single reliable cross-industry India benchmark is currently published, so treat this as an account-specific trend metric rather than a fixed target. Compare it against your own historical average first. When to act: Rising CPM without corresponding view-through or assisted conversion improvement may indicate audience fatigue.
Budget Utilisation Rate
What it is: The percentage of your set daily budget your campaigns are actually spending. Formula: Actual Daily Spend ÷ Daily Budget × 100 What good looks like: 85%–100% consistently indicates healthy demand within your targeting. When to act: Consistently below 70% means targeting is too narrow, bids too low, or ads limited by approval issues.
Quality and Relevance Metrics — Are Google and Users Satisfied?
Quality metrics are where most accounts have their largest untapped lever — improving Quality Score simultaneously lowers CPC and improves Ad Rank. As we explain in our Google Ads management approach, Quality Score optimisation is one of the first audits we run on any new account.
Quality Score
What it is: Google’s 1–10 rating of relevance and quality of your keyword, ad copy, and landing page combination, relative to competitors. Formula: Composite of Expected CTR + Ad Relevance + Landing Page Experience. What good looks like: 7–10 is the target. An 8–10 score can reduce effective CPC by 30%–50% versus a 3–4 score on the same keyword. When to act: Diagnose which sub-component is dragging the score down, then address it specifically.
Expected CTR
What it is: Google’s prediction of how likely your ad is to be clicked for a given keyword, relative to competitors. When to act: “Below Average” means your ad copy doesn’t match what users expect. Include the exact keyword phrase in Headline 1 and lead with a differentiated value proposition.
Ad Relevance
What it is: How closely your ad copy matches the intent and language of the search query. When to act: “Below Average” requires tighter ad group structure — fewer keywords per group, dedicated ad copy per intent.
Landing Page Experience
What it is: Google’s assessment of how relevant, useful, and trustworthy your landing page is. When to act: Often the most expensive problem because it affects every keyword simultaneously. Match the landing page headline to the ad’s offer, improve Core Web Vitals, provide one clear conversion action.
Ad Strength
What it is: A Poor-to-Excellent rating of the variety and quality of headlines/descriptions in Responsive Search Ads. When to act: Poor Ad Strength usually means headlines are too similar or too heavily pinned. Unpin most assets and write across different angles.
Conversion and Revenue Metrics — Are Clicks Turning Into Outcomes?
This is the most business-critical category. Impressions and clicks are intermediate metrics; conversions are outcomes. Every other metric should ultimately be evaluated by how it influences these numbers.
Accurate conversion tracking is the single most important technical setup decision in any account — if your numbers here don’t add up, start by checking whether tracking itself is broken before touching bids or budgets. For the equivalent framework on Meta, see our Meta Ads Metrics List.
Conversions
What it is: The number of times users completed a goal action after clicking your ad. Formula: Count of completed conversion actions attributed to ad clicks within your attribution window. When to act: Zero conversions on a live campaign is almost always a tracking problem before it’s a campaign problem.
Conversion Rate
What it is: The percentage of clicks that result in a completed conversion — your landing page and offer quality metric. Formula: (Conversions ÷ Clicks) × 100 What good looks like: The 2026 average Search conversion rate across industries is 8.18% (per WordStream/LocaliQ) — notably higher than in past years; conversion rates rose across 87% of industries year-over-year. By category, this ranges from 2.64% (Finance & Insurance) up to 16.22% (Animals & Pets), so weigh your own vertical’s number more heavily than the blended average. When to act: A conversion rate meaningfully below your industry benchmark on commercial keywords almost always indicates a landing page problem, not an ads problem.
Cost Per Acquisition (CPA) / Cost Per Lead (CPL)
What it is: The average amount spent to generate one conversion — the unit economics metric for any campaign. Note: most published industry benchmarks (including WordStream/LocaliQ’s) report this as cost per lead (CPL) specifically, since “acquisition” definitions vary too much across businesses to benchmark directly — treat CPL data as the closest available reference point for CPA, not an exact match. Formula: Total Cost ÷ Total Conversions What good looks like: The 2026 average CPL across industries is $66.69 (per WordStream/LocaliQ) — up from $59.18 in 2016, though CPL actually declined year-over-year for the first time in five years. By industry this ranges from $26.84 (Arts & Entertainment) to $131.63 (Attorneys & Legal Services). Still, the only target that matters for your business is one set as a function of your average order value and gross margin — not the industry average. Not sure whether CPA, CPL, or ROAS should anchor your reporting? See CPL vs CPA vs ROAS — Here’s Which One Actually Grows Your Business. When to act: CPA rising above target over a sustained period requires campaign-level diagnosis before cutting budget from the whole campaign.
Return on Ad Spend (ROAS)
What it is: Revenue generated for every rupee spent — the closest native metric to direct profitability. Formula: Total Conversion Revenue ÷ Total Ad Spend What good looks like: 3× is the widely-used minimum-viable threshold for most businesses once cost of goods, overhead, and margin are factored in. There’s no single authoritative published industry-average ROAS the way CTR/CPC/CVR/CPL are benchmarked — treat any “average ROAS” figure you see cited elsewhere with caution, since it depends heavily on business model and margin structure. Our own KashmirTickets.com campaigns consistently run at 4.8× ROAS. When to act: Declining ROAS should trigger segmented analysis — cut underperforming segments, don’t cut the whole account.
Conversion Value & Conversion Value Per Conversion
What it is: Total and average revenue attributed to conversions, requiring transaction values passed to Google Ads. When to act: If two campaigns have similar CPA but different Value Per Conversion, shift budget toward the higher-value campaign.
All Conversions
What it is: A broader count including view-through, cross-device, and store-visit conversions. When to act: Useful for understanding assisted impact of awareness campaigns — keep in a secondary column, not your primary bidding signal.
Competitive and Auction Metrics — How Do You Compare?
Auction Insights metrics show how your campaigns perform relative to specific competitors bidding on the same keywords.
Absolute Top Impression Share
What it is: The percentage of impressions in the very first paid position above organic results. Formula: Absolute Top Impressions ÷ Eligible Absolute Top Impressions What good looks like: 80%–90%+ for branded campaigns.
Top Impression Share
What it is: The percentage of impressions anywhere above organic results (positions 1–4). What good looks like: 65%+ for high-priority commercial keywords.
Auction Overlap Rate
What it is: How often a specific competitor’s ad appeared in the same auction as yours. When to act: Use high-overlap competitors as your benchmark for Quality Score and CTR comparison.
Position Above Rate
What it is: How often a competitor’s ad showed in a higher position than yours in shared auctions. When to act: High Position Above Rate combined with high Lost IS (Rank) confirms a Quality Score or bid problem.
Outranking Share
What it is: The inverse — how often your ad outranked a specific competitor’s. What good looks like: Above 50% against primary competitors on core terms.
Advanced Metrics for Scaling Campaigns
Once campaigns generate positive ROAS consistently, the focus shifts from stabilisation to scale.
Search Terms Report
The most important report in any Search campaign — the exact queries that triggered your ads. Review weekly; add irrelevant terms as negatives, add high-converters as exact-match targets.
Call Conversions
Conversions from phone calls, frequently under-tracked for service businesses. Formula: Count of calls meeting your minimum duration threshold (typically 60 seconds).
Bid Strategy Type
Manual CPC, Enhanced CPC, Maximise Clicks/Conversions, Target CPA/ROAS. Smart Bidding strategies need 30–50 conversions/month to perform reliably.
Optimisation Score
Google’s 0–100% configuration rating. A directional indicator, not an absolute — evaluate each recommendation against your actual strategy.
Frequency (Display and YouTube)
What it is: Average number of times a unique user has seen your ad in a period. Formula: Total Impressions ÷ Unique Reach What good looks like: 3–5 times per user per week for most awareness campaigns. When to act: Frequency above 7–10 combined with declining CTR is ad fatigue — refresh creative or apply frequency caps.
Quick Reference: All PPC Campaign Metrics at a Glance

| Metric | Category | Formula | Benchmark | Action Trigger |
|---|---|---|---|---|
| Impressions | Volume | Platform count | Growing W/W | Sudden drop → check disapprovals |
| Clicks | Volume | Platform count | Proportional to IS | High impr., low clicks → fix headlines |
| CTR | Volume | Clicks ÷ Impressions | 6.64% avg (Search)¹ | Below industry avg → rewrite ad copy |
| Impression Share | Volume | Imp. ÷ Eligible Imp. | 80%+ (branded) | <40% → diagnose budget or rank |
| Lost IS (Budget) | Volume | Google-reported | <10% | >20% → increase budget |
| Lost IS (Rank) | Volume | Google-reported | <10% | High → fix Quality Score first |
| Cost (Spend) | Cost | Sum of charges | Proportional to ROAS | Rising without ROAS improvement → segment |
| CPC | Cost | Cost ÷ Clicks | $5.42 avg (Search)¹ | Rising + flat conv. rate → check QS |
| CPM | Cost | (Cost ÷ Imp.) × 1,000 | No reliable published avg — track vs. own history | Rising → check audience fatigue |
| Quality Score | Quality | 1–10 composite | 7–10 (no published avg exists) | <5 → full QS audit |
| Conversions | Conversion | Platform count | Growing M/M | Zero → verify tracking first |
| Conversion Rate | Conversion | Conv. ÷ Clicks | 8.18% avg (Search)¹ | Below industry avg → landing page audit |
| CPA / CPL | Conversion | Cost ÷ Conv. | $66.69 avg CPL (Search)¹ | Above target → segment by keyword |
| ROAS | Conversion | Revenue ÷ Spend | 3×+ minimum viable (business-specific; no reliable published industry avg) | Declining → cut underperforming segments |
| Abs. Top IS | Competitive | Abs. Top ÷ Eligible | 80%+ (branded) | Low branded → check competitor bidding |
| Frequency | Advanced | Imp. ÷ Unique Reach | 3–5/week (awareness) | >7 + falling CTR → refresh creative |
¹ Overall Search Network averages per WordStream/LocaliQ’s 2026 Google Ads Benchmarks report, based on 13,474 US search campaigns, April 2025–March 2026. These are cross-industry medians — always weigh your specific industry’s figure (given in the sections above) more heavily than the blended average, and your own account’s history more heavily still.
The Metric Hierarchy That Actually Matters
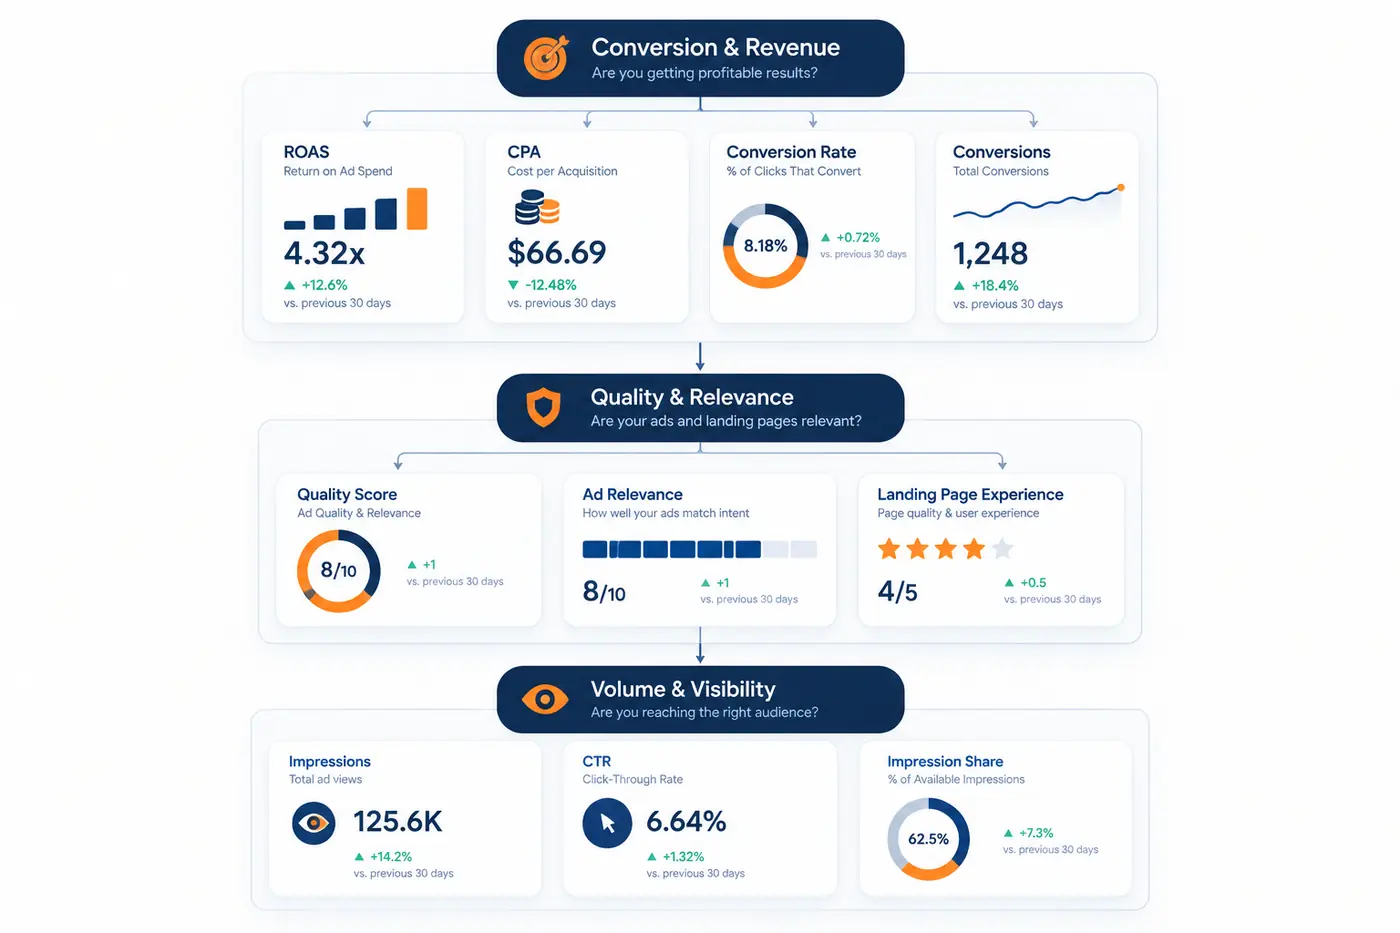
Start with Conversion and Revenue metrics. ROAS, CPA, Conversion Rate, and total Conversions tell you whether the campaign is profitable. If these are healthy, everything else is context. If broken, everything else is a clue.
Then check Quality metrics. Quality Score, Landing Page Experience, and Ad Relevance explain why your economics look the way they do.
Then check Volume metrics. Impression Share and the Lost IS metrics tell you whether your campaign has the reach to generate the conversions your business requires.
Use Competitive metrics for strategy, not daily optimisation.
For a broader view of how paid advertising fits into a full-funnel strategy, see our guide on integrating SEO, SEM and social for better ROI. If you’re still deciding between channels in the first place, PPC vs SEO: Which One Should Your Business Invest In? breaks down that decision, and Meta Ads vs Google Ads covers the paid-platform side of it.
For how Google defines these metrics at the platform level, Google’s own campaign performance documentation is the authoritative reference — though interpreting what to do when the numbers move is a different discipline entirely.
Frequently Asked Questions About PPC Campaign Metrics
What are PPC campaign metrics?
PPC campaign metrics are the measurements — impressions, clicks, cost, conversions, and the ratios between them — that show whether a paid campaign is reaching people, being clicked, and turning into results. They’re grouped into volume, cost, quality, conversion, and competitive categories.
What are the most important PPC campaign metrics to track?
CTR, Quality Score, Conversion Rate, CPA, ROAS, and Impression Share. These six give a complete read on ad relevance, campaign economics, and competitive positioning simultaneously.
What is a good CTR for Google Ads in 2026?
The average Search Network CTR across industries in 2026 is 6.64%, according to WordStream/LocaliQ’s 2026 Google Ads Benchmarks report (13,474 US search campaigns). By industry it ranges from about 5.6% to 12.8%, so compare against your own vertical first. Branded campaigns typically run well above their category average, and Display Ads sit far lower at roughly 0.35%–0.5%.
What is ROAS and what is a good ROAS?
ROAS is Return on Ad Spend — revenue generated per rupee spent, calculated as total conversion revenue ÷ total ad spend. A 3× minimum viable ROAS applies to most businesses, but the right target depends on your gross margin.
What does Quality Score mean and why does it matter?
Quality Score is Google’s 1–10 rating of keyword, ad copy, and landing page relevance. It directly determines Ad Rank and effective CPC — an 8–10 score can cut CPC by 30–50% versus a 3–4 score on the same keyword.
What is Impression Share?
The percentage of eligible impressions your ads actually received. The remainder is lost either to insufficient budget (Lost IS Budget) or insufficient Ad Rank (Lost IS Rank) — Google reports both separately.
How many PPC campaign metrics should I track?
A core dashboard of 8–12 is optimal: Impressions, Clicks, CTR, CPC, Quality Score, Conversions, Conversion Rate, CPA, ROAS, and Impression Share with its Budget/Rank sub-metrics.
What should I check first when conversions drop suddenly?
First, verify conversion tracking is still firing — tag breakage is the most common cause and invisible in the main metrics view. Then check impression volume, then Conversion Rate, then Impression Share for auction competition changes.
The Bottom Line
Google Ads gives you access to more data than any campaign actually needs. The businesses that get the best results are not the ones tracking the most metrics — they’re the ones tracking the right ones for their objective, understanding what each is telling them, and acting on it consistently.
Start with the six essentials: CTR, Quality Score, Conversion Rate, CPA, ROAS, and Impression Share. Get those healthy and stable. Then use competitive and advanced metrics to find the next increment of performance.
For more on how we build and manage Google Ads campaigns, see our Google Ads service page. If you’re building your own skills across paid media, our 1-on-1 digital marketing mentorship programme covers Google Ads campaign management with real account access.
Running Google Ads and not seeing the returns your spend should be generating? At Harmukh Technologies, we audit accounts and identify exactly where budget is being lost. Get in touch for an honest account assessment.