
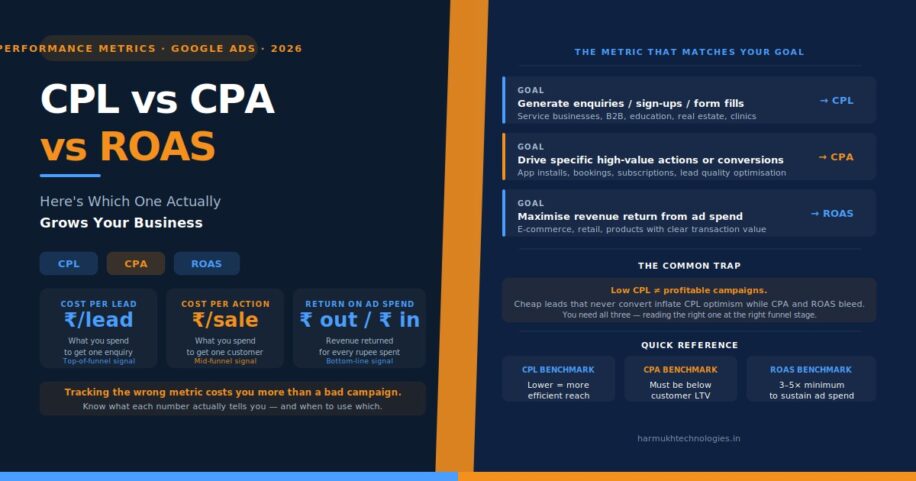
These three metrics sit in every dashboard. Most businesses read them together as if they’re the same story. They’re not. Each one answers a completely different question and the one you choose to optimise for determines whether your campaign grows or quietly bleeds budget while looking healthy.
Harmukh Technologies
July 1, 2026 · 12 min read
Here is a situation we see often.
A business is running Google Ads and Meta Ads simultaneously. The Google Ads account shows a strong ROAS — say, 4.2×. The Meta Ads account shows a low CPL. The founder is happy. The agency reports are green. Then, three months later, the business realises it is not growing. Revenue is flat. The pipeline is inconsistent. Leads are coming in but they’re not converting into actual customers.
What happened?
They were optimising for the metric that made the dashboard look good, not the metric that reflected actual business health. The ROAS was technically accurate but calculated on a narrow attribution window that excluded repeat purchases and upsells. The CPL was genuinely low — but it was counting form fills, not qualified leads. The CPA was never tracked at all.
This is not an unusual situation. It is the default for most small and mid-sized businesses running paid campaigns without a clearly defined measurement framework.
This post untangles all three metrics — what each one actually measures, where each one breaks down, and how to decide which one should be the primary signal driving your campaign decisions. We will also show you where they work together, because the real answer is rarely one metric in isolation.
At Harmukh Technologies, we run Google Ads and Meta Ads for clients across India, UAE, UK, US, and Australia. The pattern of businesses optimising for the wrong metric — and not knowing it — shows up in almost every account audit we run. Here is what we’ve learned.
In This Article
- The Plain-English Definitions: CPL, CPA, and ROAS
- CPL — Cost Per Lead: When It’s Right and When It Misleads You
- CPA — Cost Per Acquisition: The Metric Most Businesses Underuse
- ROAS — Return on Ad Spend: The Most Misread Metric in Paid Advertising
- Which Metric Should You Actually Optimise For?
- How CPL, CPA, and ROAS Work Together in a Real Campaign
- The 4 Metric Mistakes That Kill Campaigns That Look Healthy
- The Measurement Framework We Use at Harmukh
The Plain-English Definitions: CPL, CPA, and ROAS
Before we get into strategy, let’s be precise about what each metric is actually measuring. These are not interchangeable terms. They answer different questions at different stages of the funnel.
| Metric | Full Name | What It Measures | Formula |
|---|---|---|---|
| CPL | Cost Per Lead | How much you paid to get one person to express interest | Ad Spend ÷ Leads Generated |
| CPA | Cost Per Acquisition | How much you paid to get one paying customer | Ad Spend ÷ Customers Acquired |
| ROAS | Return on Ad Spend | How much revenue every rupee of ad spend generated | Revenue Generated ÷ Ad Spend |
The reason these get conflated is that they all live in the same dashboards and they all go up or down together in certain situations. When campaigns are running well, CPL drops, CPA drops, and ROAS rises — and everything looks correlated. When something breaks, all three can move in the same direction. This creates the illusion that they’re measuring the same thing.
They are not. The gap between a low CPL and a sustainable CPA is where most campaign budgets disappear.
CPL — Cost Per Lead: When It’s Right and When It Misleads You

CPL is the most commonly used metric in lead generation campaigns — and the most commonly misapplied one.
It answers a straightforward question: how much did it cost to get someone to raise their hand? A form fill. A phone call. A WhatsApp enquiry. A consultation booking. All of these can be defined as leads, which is where the first problem starts.
When CPL is the right metric to optimise for:
- You are in the early stages of a campaign and need volume data before you can model conversion rates
- Your sales team closes a consistent percentage of leads and your lead quality is stable
- You are running top-of-funnel awareness campaigns where the goal is pipeline building, not immediate revenue
- You have a long sales cycle (real estate, B2B services, high-value consulting) where direct conversion attribution is difficult
- You need to compare performance across different ad platforms before committing budget to one
When CPL misleads you:
⚠️ The CPL trap
A campaign generating leads at ₹200 CPL looks dramatically better than one generating leads at ₹800 CPL. But if the ₹200 leads close at 2% and the ₹800 leads close at 35%, the second campaign is producing customers at a fraction of the cost. CPL hides lead quality — and lead quality is almost always where the real money is made or lost.
- Your lead definition is too broad. If you count every form submission as a lead — including spam, wrong numbers, and unqualified enquiries — your CPL is artificially low and your sales team is wasting time
- You are optimising the ad, not the funnel. A well-targeted ad that sends people to a poor landing page will generate low-intent leads cheaply. The CPL looks good. The close rate is terrible.
- You have no lead scoring. Without distinguishing hot leads from cold ones, you cannot improve the metric that actually matters — how many of those leads become customers
- Platform attribution inflates your count. Meta Ads, by default, attributes any lead form fill within a 7-day click or 1-day view window. Many of those leads would have come in organically or through direct search. Your actual paid CPL may be much higher than reported.
For service businesses running Meta Ads campaigns in India — clinics, real estate brokers, education institutes, legal firms — CPL is almost always the primary reported metric and almost always the wrong one to optimise for without a lead quality filter sitting behind it.
What to do instead:
Define your lead in two tiers. Tier 1 is a raw enquiry — the form fill or call. Tier 2 is a qualified lead — someone who meets your criteria for income, intent, location, or service fit. Track CPL for both separately. Optimise for Tier 2 CPL, not Tier 1. If your CRM does not support this, build a simple qualification step into your follow-up process and track it manually.
CPA — Cost Per Acquisition: The Metric Most Businesses Underuse
CPA is the metric that tells you what you actually paid to acquire a paying customer. Not a lead. Not a form fill. A customer who gave you money in exchange for a product or service.
It is the most honest metric in paid advertising — and the most underused, especially among small and mid-sized businesses in India who equate “conversion” with “lead” rather than “sale.”
Why CPA is the most important metric for service businesses:
The only number that determines whether a paid campaign is profitable is: how much did a customer cost to acquire versus how much revenue they generate over their lifetime with you?
CPL tells you the cost of the top of your funnel. ROAS tells you a revenue ratio. CPA is the bridge — it tells you the cost of the moment when a lead became money. Without it, you are managing a campaign in the dark.
A real example from our client accounts:
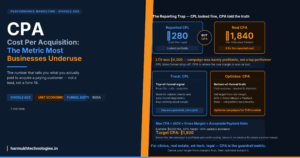
A healthcare clinic was running Meta Ads with a CPL of ₹280. They were happy with this number. When we mapped the full funnel — from lead to booked appointment to attended appointment to repeat visit — the actual CPA (cost to acquire a paying patient who showed up) was ₹1,840. That’s a 6.6× gap between the reported metric and the real business cost.
The average patient lifetime value was ₹4,200. That meant the campaign was marginally profitable at best — not the strong performer the CPL suggested. Restructuring the campaign to optimise for attended appointments (a true acquisition event) dropped actual CPA to ₹960 within 60 days.
When CPA is the right primary metric:
- You are a service business where the conversion event is a paid appointment, consultation, or contract signing
- You have enough conversion volume to feed algorithmic bidding strategies — Google’s Target CPA smart bidding requires a minimum of 30–50 conversions per month to function reliably
- You have a consistent average order value or service fee, so the CPA can be evaluated against a fixed margin
- You are scaling a campaign and need a single guardrail metric that accounts for both acquisition cost and funnel efficiency
The CPA calculation most businesses skip:
Your target CPA should be derived from your unit economics, not from what “feels right” or what a competitor mentioned. The formula is:
Max CPA = (Average Order Value × Gross Margin) × Acceptable Payback Period Ratio
Example:
Average service fee: ₹8,000
Gross margin: 60% → ₹4,800 contribution
Acceptable payback: you are willing to spend up to 40% of first-order contribution on acquisition
Target CPA: ₹1,920
If your actual CPA is below this number, your campaign is profitable and worth scaling. If it is above it, no amount of creative refresh or audience adjustment fixes a structurally broken unit economics problem.
This is the foundation of how we approach performance marketing at Harmukh — every campaign starts with a target CPA derived from the client’s real margins, not from platform benchmarks.
ROAS — Return on Ad Spend: The Most Misread Metric in Paid Advertising
ROAS is the metric most commonly cited in agency reports, most frequently used in pitch decks, and most frequently misunderstood by the business owners reading them.
A 4× ROAS means you generated ₹4 in revenue for every ₹1 you spent on ads. It sounds definitive. It often is not.
What ROAS actually measures — and what it doesn’t:
ROAS measures revenue relative to ad spend. It does not measure profit. It does not account for cost of goods, fulfilment costs, refunds, agency fees, or operational overhead. A business with 20% gross margins and a 4× ROAS is losing money on every sale. A business with 70% gross margins and a 2× ROAS may be operating profitably.
⚠️ The ROAS number that looks great but means nothing
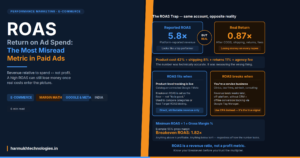
We audited a client’s Google Ads account showing a consistent 5.8× ROAS. When we factored in product cost (42%), shipping (8%), returns (11%), and agency fee, the actual return on every rupee spent was 0.87×. They were losing money at 5.8× ROAS. The metric was technically accurate. It was measuring the wrong thing.
The right way to use ROAS:
ROAS is most valuable when:
- You are running e-commerce campaigns with product-level revenue tracking properly configured in Google Ads or Meta Ads through a connected catalogue
- You have calculated your minimum ROAS threshold — the break-even point below which ad spend generates no net profit — and are using that as the floor, not an arbitrary benchmark like “4× is good”
- You are comparing performance across product categories or campaign types and need a normalised efficiency ratio
- You are feeding algorithmic bidding — Google’s Target ROAS smart bidding strategy uses conversion value data to optimise bids in real time
How to calculate your minimum ROAS:
Minimum ROAS = 1 ÷ Gross Margin %
Example:
Gross margin: 55%
Minimum breakeven ROAS: 1.82×
Anything above 1.82× is profitable. Anything below is not — regardless of what the number looks like.
This is the calculation that most businesses never run. They see 3× ROAS and feel confident. They should be asking: is 3× above or below my breakeven? The answer depends entirely on their margin structure.
ROAS for service businesses — why it often doesn’t apply:
If you are a service business — a law firm, a clinic, an education institute, a consultancy — ROAS is usually not the right primary metric because your “revenue” is difficult to attribute directly to an ad. You cannot tell Google Ads that a patient paid ₹6,000 three weeks after clicking your ad unless you have robust CRM integration and offline conversion tracking set up through Google Tag Manager.
Without that setup, the ROAS your platform reports is either incomplete or meaningless. This is precisely why we track CPA as the primary metric for service businesses and reserve ROAS for e-commerce and product-based accounts where revenue attribution is direct and measurable. Our Google Tag Manager conversion tracking guide covers exactly how to set up the infrastructure that makes these metrics trustworthy.
Which Metric Should You Actually Optimise For?
The answer depends on your business model, your funnel length, and how well your conversion tracking is configured. Here is the decision framework:
| Business Type | Primary Metric | Secondary Metric | Why |
|---|---|---|---|
| E-commerce (product sales) | ROAS | CPA | Revenue is directly attributable to ad clicks via catalogue tracking |
| Service business (clinic, law, education) | CPA | Qualified CPL | Revenue attribution is indirect; CPA captures the actual cost of a paying customer |
| Real estate / high-ticket B2B | Qualified CPL | CPA | Long sales cycles make CPA hard to attribute in-platform; qualified leads are the measurable proxy |
| SaaS / subscription | CPA | LTV:CAC ratio | Recurring revenue makes upfront CPA acceptable if LTV is high enough; ROAS ignores renewals |
| Local business (restaurant, salon, gym) | CPL or CPA | Foot traffic proxy | Depends on whether online bookings or walk-ins are the primary conversion goal |
The single most important thing on this table is that there is no universal right answer. The right metric is the one that most accurately represents value created for your business — not the one that makes your dashboard look most impressive.
How CPL, CPA, and ROAS Work Together in a Real Campaign
The three metrics are not rivals. In a well-structured campaign, they each do a specific diagnostic job at a different layer of the funnel. Here is how they map:
When you read all three together, each one points to a different part of the system. CPL diagnoses the ad. CPA diagnoses the funnel. ROAS diagnoses the offer. A problem in any one of them suggests a specific fix — and that specificity is what most dashboards fail to provide when they present all three numbers without context.
This is the approach we take in every performance marketing engagement — building Looker Studio dashboards where CPL, CPA, and ROAS are tracked in layers, with clear thresholds for each that trigger specific actions rather than generic “optimise the campaign” responses.
The 4 Metric Mistakes That Kill Campaigns That Look Healthy

These are the patterns we see most frequently in accounts we audit — campaigns where the numbers look fine on screen while the business underneath is underperforming.
Mistake 1: Using Platform-Reported ROAS as Your Revenue Number
Both Google Ads and Meta Ads overcount conversions. Google uses last-click attribution by default. Meta uses a 7-day click / 1-day view window that attributes purchases to an ad even when the actual purchase decision was made days before the ad was seen.
The result: your platform ROAS is almost always higher than your actual revenue return. The industry term for this gap is “reported ROAS vs. actual ROAS.” The way to close it is through data-driven attribution in GA4 and offline conversion tracking — not by trusting the number in your Ads dashboard at face value.
Mistake 2: Optimising CPL Without Tracking Lead Quality
Lowering CPL is easy. Run broad audiences, low-friction lead forms, aggressive bidding. You will generate more leads at a lower cost. Most of them will be worthless. The campaigns that generate sustainable business results are built around qualified lead rate — the percentage of leads that meet your criteria for real sales potential — not raw lead volume.
If your Meta Ads or Google Ads campaign uses Instant Forms without a qualification question, you are almost certainly counting low-quality leads in your CPL. Add one or two qualifying fields to your lead form — budget range, service needed, location, timeline — and watch your CPL rise and your sales team’s close rate rise faster.
Mistake 3: Setting a Target CPA Based on Competitor Benchmarks
Industry CPA benchmarks are averages across businesses with completely different margins, sales cycles, and offer structures. A ₹500 CPA might be extraordinary for a high-margin digital product and catastrophic for a business with 15% gross margins selling physical goods.
Your target CPA must be derived from your own unit economics — the calculation outlined in the CPA section above. Every other basis for a CPA target is a guess dressed up as a strategy.
Mistake 4: Switching Metrics Mid-Campaign When Results Slip
This is the most common pattern in accounts where the business is managing its own ads or where an agency is under pressure to show positive numbers. When ROAS drops, switch the conversation to CPL. When CPL rises, switch to impressions or CTR. This metric-hopping creates the illusion of performance while hiding systematic underperformance.
The solution is to agree on your primary metric before the campaign launches, define the threshold at which action is required, and hold to it. Changing the metric is not optimisation. It is reframing.
The Measurement Framework We Use at Harmukh
For every new client campaign, we go through the same setup sequence before we spend a single rupee of ad budget. It looks like this:
Define the conversion event precisely
Not “a lead.” A specific, unambiguous user action — a consultation booked and confirmed, a product purchased and not refunded, a contract signed. This event becomes the denominator in both your CPA and your ROAS calculation.
Calculate the target CPA from margin data
Before touching bids, audiences, or creatives — know the maximum you can pay per acquisition and remain profitable. This number is non-negotiable and drives every subsequent decision.
Set up conversion tracking before going live
GTM-based conversion tracking, GA4 event mapping, and offline conversion import for service businesses. Without clean tracking, your metric is measuring something approximated, not something real. Our GTM conversion tracking guide walks through the exact setup.
Track CPL at the top, CPA in the middle, ROAS at the bottom
Each metric has its layer. Each one triggers specific actions when it moves outside threshold. We build this into our Looker Studio dashboards so the diagnostic is always visible alongside the number.
Review by layer, not in aggregate
A monthly campaign review should walk through: CPL trend by audience and creative → CPA trend by campaign and keyword → ROAS trend by product or service category. Each layer tells you where the issue is and what category of fix it requires.
This structure is why the campaigns we manage compound over time rather than plateau. Knowing which metric to act on — and what that metric is telling you — is the difference between managing a campaign and just watching it.
If you are running paid ads and are unsure whether you are tracking and optimising for the right metric, understanding the relationship between organic vs paid strategy is a good place to start — because the decision of which channel to invest in depends on the same unit economics logic that governs which metric to optimise for.
The Bottom Line
CPL tells you how efficiently you are filling the top of your funnel. CPA tells you how much a paying customer actually cost. ROAS tells you how much revenue that spend generated. They are three different lenses on the same campaign — and optimising for the wrong one is how campaigns generate impressive dashboards while quietly failing at their actual job.
The metric you optimise for should be the one that most directly corresponds to the business outcome you are trying to achieve. Not the one that looks best in a weekly report. Not the one your platform defaults to tracking. The one that, when it moves in the right direction, means your business is genuinely growing.
If you are not sure which metric that is for your specific business — or if you want a team that builds campaigns around your actual unit economics rather than platform benchmarks — that is the conversation we have with every new client before we touch a single setting. It starts with a free consultation with Harmukh Technologies.
Free Consultation
Not Sure Which Metric Your Campaign Should Be Optimising For?
We audit the numbers, identify the right primary metric for your business model, and build the tracking infrastructure to measure it accurately.