
About this guide: Written by the performance marketing team at Harmukh Technologies, a Google Ads agency managing campaigns across India, UAE, UK, and Australia. Every benchmark and framework in this article comes from live campaign data — not documentation or theory.
Last updated: March 2026 | Reading time: 14 minutes
Open any Google Ads account and you will find over 150 columns available in the reporting dashboard. Most of them are noise. A handful of them — if you know what they mean and when to act on them — are the difference between a campaign that drains budget and one that compounds into a reliable revenue channel.
This guide covers every Google Ads metric that actually matters. For each one, you will find the formula, what good looks like, and the specific action to take when something is wrong. It is written by practitioners who manage real campaigns — not by people who summarise Google’s Help Centre and call it expertise.
In This Guide
- What are Google Ads metrics and why do most businesses track the wrong ones?
- Volume and visibility metrics — are enough people seeing your ads?
- Cost and spend metrics — what are you actually paying?
- Quality and relevance metrics — are Google and users satisfied with your ads?
- Conversion and revenue metrics — are clicks turning into outcomes?
- Competitive and auction metrics — how do you compare?
- Advanced metrics for scaling campaigns
- Quick reference table: all Google Ads metrics at a glance
- Frequently asked questions
What Are Google Ads Metrics and Why Do Most Businesses Track the Wrong Ones?
Google Ads metrics are the data points the platform uses to report on how your campaigns, ad groups, keywords, and individual ads are performing. They fall into five meaningful categories: volume, cost, quality, conversion, and competitive. Each category tells a different part of the story. Ignoring any one of them creates a blind spot that costs money.
The mistake most businesses make is tracking metrics that are easy to see — impressions, clicks, website sessions — rather than metrics that connect directly to business outcomes. Impressions tell you how many times your ad appeared. Revenue tells you whether that appearance was worth anything. The gap between those two numbers is where most Google Ads budgets disappear.
The second mistake is reading metrics in isolation. A 10% CTR looks excellent until you check the Conversion Rate and find that only 0.3% of those clicks converted. A low CPC looks efficient until you discover the keywords driving cheap clicks have zero commercial intent. Metrics only tell the truth when they are read together.
This is central to how we structure campaign reporting at Harmukh Technologies. As part of our performance marketing campaign setup process, every client dashboard surfaces only the metrics with direct decision-making value — and connects each one to a business outcome. This guide is the framework behind that dashboard.
Volume and Visibility Metrics — Are Enough People Seeing Your Ads?
Volume metrics tell you whether your campaigns are reaching a meaningful audience in the first place. A campaign can be structurally excellent and still fail because bids, budget, or targeting are preventing it from entering auctions at sufficient scale. These are always the first metrics to check when a campaign is underperforming.
Impressions
What it is: The number of times your ad appeared on Google’s network — Search, Display, YouTube, Shopping, or Partner sites. One user seeing your ad three times counts as three impressions.
Formula: Platform-reported count of ad displays.
What good looks like: Growing week-on-week for any campaign with sufficient budget and competitive bids. A sudden drop without a deliberate account change is always worth investigating immediately — common causes include budget exhaustion, disapproved ads, paused keywords, or a Quality Score collapse.
When to act: If impressions drop sharply without explanation, check for ad disapprovals, budget caps, and bid floors before assuming a broader platform issue.
Clicks
What it is: The number of times users clicked your ad and landed on your destination URL. Google filters invalid clicks before billing — what you see in the dashboard is verified, charged traffic only.
Formula: Platform-reported count of valid clicks.
What good looks like: Proportional to your impression volume given your CTR benchmark. If impressions are high but clicks are flat, the issue is almost always the ad itself — not bidding or budget.
When to act: High impressions with low clicks means your headlines, offer, or extensions are not compelling the click. Test new headline angles before adjusting bids.
Click-Through Rate (CTR)
What it is: The percentage of people who saw your ad and chose to click it. CTR is your real-world ad relevance signal — and Google uses historical CTR as a significant input into Quality Score calculation.
Formula: (Clicks ÷ Impressions) × 100
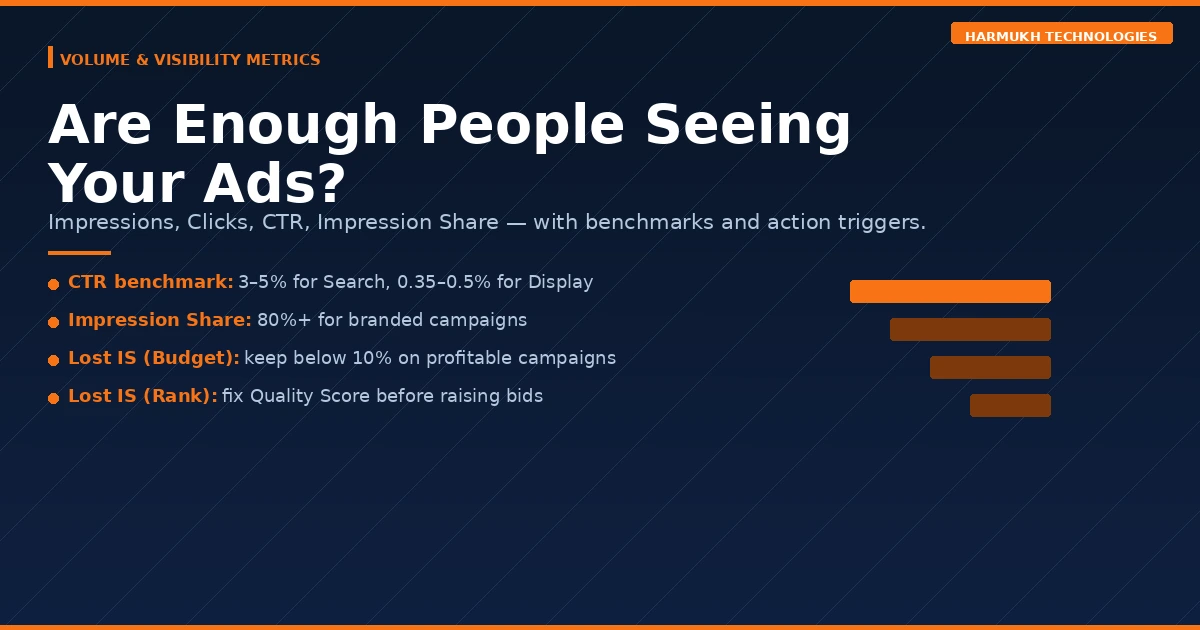
What good looks like: For Google Search Ads, 3%–5% is a healthy benchmark across most industries. Branded campaigns can exceed 15%–20%. For Display Ads, 0.35%–0.5% is considered strong. Always compare your CTR against your own historical baseline as a primary reference.
When to act: A Search CTR below 1% almost always indicates a headline-to-keyword mismatch. Rewrite your top headlines to include the exact search term and lead with a specific benefit or number.
Impression Share
What it is: The percentage of total eligible impressions your ads actually received. If your Impression Share is 60%, your ads showed in 60 out of every 100 auctions they qualified for.
Formula: Impressions Received ÷ Total Eligible Impressions
What good looks like: 80%+ for branded campaigns. 50%–70% is acceptable for competitive non-branded terms depending on budget. Below 40% on core terms indicates a meaningful gap that competitors are filling.
When to act: Low Impression Share has two distinct causes — budget or rank — and Google tells you which directly through the Lost IS metrics below.
Search Impression Share Lost to Budget
What it is: The percentage of eligible impressions you missed specifically because your daily budget ran out before the day ended. Every missed impression here is a qualified search your competitor answered instead.
Formula: Reported directly by Google.
What good looks like: Below 10%. Anything above 20% on a profitable campaign is a budget allocation problem, not a campaign problem.
When to act: If Lost IS (Budget) is high on campaigns with positive ROAS, increase the daily budget or restructure to concentrate spend on your highest-performing ad groups.
Search Impression Share Lost to Rank
What it is: The percentage of eligible impressions you missed because your Ad Rank was not high enough to enter the auction or secure a visible position. Ad Rank is determined by your bid multiplied by your Quality Score.
Formula: Reported directly by Google.
What good looks like: Below 10%. High Lost IS (Rank) is a Quality Score problem first, a bidding problem second.
When to act: Improving Quality Score before increasing bids is almost always the more efficient fix. Raising bids on a low-QS keyword just means paying more for the same poor position.
Cost and Spend Metrics — What Are You Actually Paying?
Cost metrics determine the economics of your campaigns. A campaign generating plenty of clicks can still be unprofitable if the cost per click, cost per conversion, or budget structure is misaligned with your margins. These metrics connect your ad spend to your financial reality.
Total Cost (Spend)
What it is: The total amount charged to your account for a campaign, ad group, or keyword over a selected time period.
Formula: Sum of all valid click charges in the period.
What good looks like: Proportional to the revenue or leads generated. Always view Cost alongside Conversions and ROAS — spend in isolation tells you nothing useful.
When to act: If cost is rising without a corresponding improvement in conversions or ROAS, isolate which campaigns, ad groups, or keywords are consuming budget without contributing outcomes.
Average Cost Per Click (CPC)
What it is: The average amount you pay each time someone clicks your ad. Actual CPC in Google’s second-price auction is almost always lower than your maximum bid — you pay only what is needed to maintain your position above the next competitor.
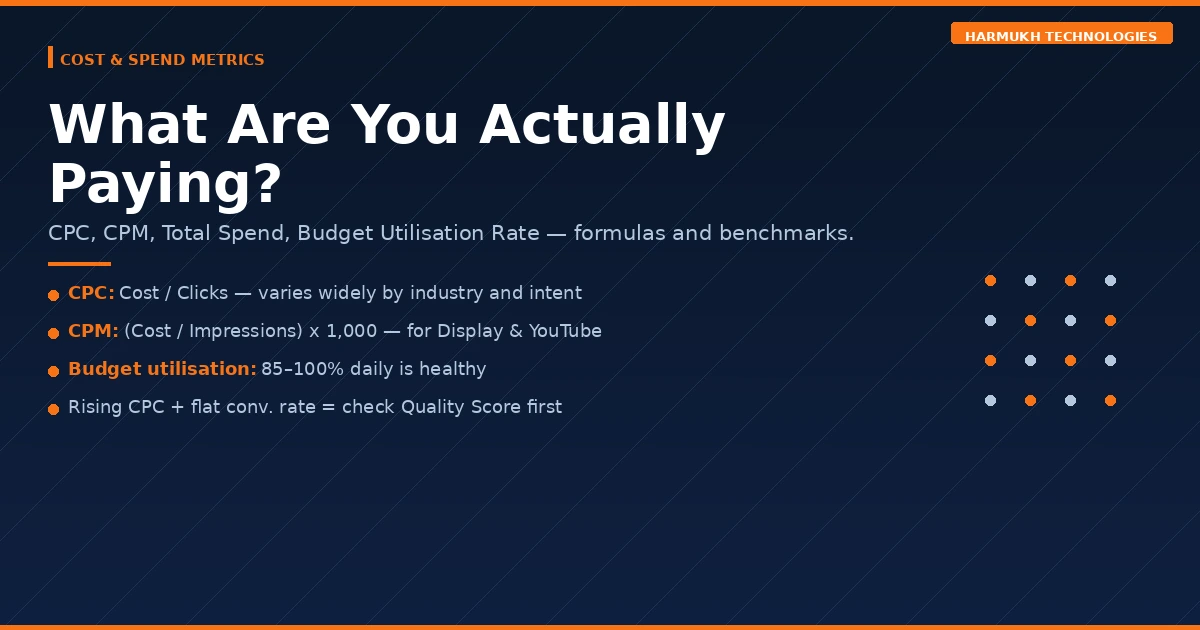
Formula: Total Cost ÷ Total Clicks
What good looks like: Varies significantly by industry, geography, and keyword intent. Legal and finance keywords in competitive markets can cost ₹200–₹800 per click. Local service keywords in less competitive markets may be ₹15–₹50. The right CPC benchmark is one that produces your target CPA given your conversion rate.
When to act: Rising CPC without a rising Conversion Rate is a profitability warning. First check if competitors have increased bids, then investigate whether your Quality Score has dropped — a lower QS forces you to bid higher to maintain the same position.
Cost Per 1,000 Impressions (CPM)
What it is: The cost of reaching 1,000 people with your ad. CPM is the primary efficiency metric for awareness-focused campaigns — Display, YouTube, and Demand Gen — where reach rather than clicks is the objective.
Formula: (Total Cost ÷ Total Impressions) × 1,000
What good looks like: For Display campaigns, ₹30–₹80 CPM is typical in Indian markets. Lower CPM on a relevant, well-defined audience is always better than lower CPM on a broad, poorly qualified one.
When to act: Rising CPM without a corresponding improvement in view-through or assisted conversions may indicate audience fatigue or increased auction competition in that targeting segment.
Budget Utilisation Rate
What it is: The percentage of your set daily budget that your campaigns are actually spending. Google may spend up to twice your daily budget on high-traffic days but averages to your monthly limit.
Formula: Actual Daily Spend ÷ Daily Budget × 100
What good looks like: 85%–100% consistently indicates healthy demand within your targeting parameters.
When to act: Consistently below 70% means your targeting is too narrow, your bids are too low to enter auctions, or your ads are being limited by approval issues. Investigate before concluding that demand simply does not exist.
Quality and Relevance Metrics — Are Google and Users Satisfied With Your Ads?
Quality metrics are where most Google Ads accounts have their largest untapped lever. Improving Quality Score is frequently the highest-ROI action available in an underperforming account — because it simultaneously lowers your CPC and improves your Ad Rank, making every rupee of spend work harder. As we explain in our Google Ads management approach, Quality Score optimisation is one of the first audits we run on any new account.
Quality Score
What it is: Google’s 1–10 rating of the relevance and quality of your keyword, ad copy, and landing page combination — relative to what competitors are offering for the same query. It is calculated at the keyword level and has three sub-components.
Formula: Composite of Expected CTR + Ad Relevance + Landing Page Experience, each rated Below Average / Average / Above Average.
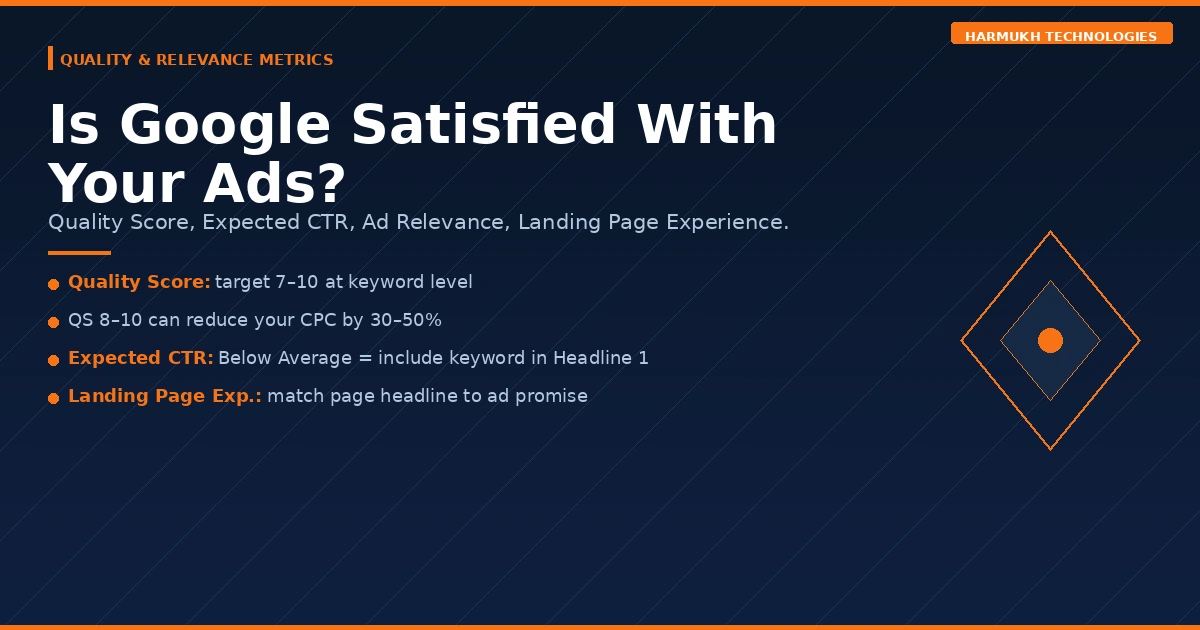
What good looks like: 7–10 is the target range. A Quality Score of 8–10 can reduce your effective CPC by 30%–50% compared to a score of 3–4 bidding on the same keyword. A score of 1–4 is a serious account health problem.
When to act: Diagnose which of the three sub-components is dragging the score down, then address that component specifically rather than making broad changes across the account.
Expected CTR (Quality Score Component)
What it is: Google’s prediction of how likely your ad is to be clicked when it appears for a given keyword, relative to all other advertisers competing for that same keyword.
Status values: Above Average / Average / Below Average
When to act: A “Below Average” rating means your ad copy is not matching what users expect to see when they search that keyword. The fix is almost always including the exact keyword phrase in Headline 1 and leading with a specific, differentiated value proposition rather than a generic category claim.
Ad Relevance (Quality Score Component)
What it is: How closely your ad copy matches the intent and language of the search query. Accounts that group dozens of loosely related keywords into a single ad group and run one generic ad across all of them suffer chronically on this component.
When to act: “Below Average” Ad Relevance requires tighter ad group structure — fewer keywords per ad group, each with dedicated ad copy written specifically for that keyword’s intent. The keyword should appear naturally in at least one headline and in the display path.
Landing Page Experience (Quality Score Component)
What it is: Google’s assessment of how relevant, useful, and trustworthy your landing page is for someone who just clicked your ad. Google evaluates page load speed, mobile usability, content relevance to the keyword, transparency about the business, and clarity of the next step.
When to act: “Below Average” Landing Page Experience is often the most expensive problem in an account because it affects every keyword simultaneously. Prioritise: ensure the landing page headline directly mirrors the ad’s offer, improve Core Web Vitals scores, and ensure the page provides a clear, single conversion action.
Ad Strength
What it is: A rating from Poor to Excellent evaluating the variety and quality of headlines and descriptions in your Responsive Search Ads. It is not a direct ranking factor, but RSAs with higher Ad Strength receive more impressions in Google’s rotation, accumulating data faster.
What good looks like: “Good” or “Excellent.” Each headline should be genuinely distinct in angle — not variations of the same phrase.
When to act: Poor or Low Ad Strength typically means headlines are too similar to each other, too short, or too heavily pinned. Unpin most assets and write headlines across different angles: the offer, the proof, the urgency, the specificity, the category claim.
Conversion and Revenue Metrics — Are Clicks Turning Into Outcomes?
This is the most business-critical category in the entire dashboard. Impressions and clicks are intermediate metrics. Conversions are outcomes — purchases, lead form submissions, phone calls, quote requests. Every other metric should ultimately be evaluated by how it influences these numbers.
Accurate conversion tracking is the single most important technical setup decision in any Google Ads account. Without it, you are optimising blind. We verify conversion tracking before spending a single rupee in every campaign we launch — and we frequently find it broken or misconfigured in accounts we inherit. For the broader metrics picture in paid advertising, our Meta Ads metrics guide covers the equivalent framework for Facebook and Instagram campaigns.
Conversions
What it is: The number of times users completed a goal action after clicking your ad. What counts as a conversion is defined by you — purchases, form submissions, phone calls, app installs, live chat initiations, or any other meaningful business event.
Formula: Count of completed conversion actions attributed to ad clicks within your attribution window.
What good looks like: Growing month-on-month at a rate proportional to your spend, or improving at stable spend through optimisation.
When to act: Zero conversions on a live campaign is almost always a tracking problem before it is a campaign problem. Use Google Tag Assistant or the Diagnose function in your conversion actions settings to verify tags are firing correctly on the confirmation or thank-you page.
Conversion Rate
What it is: The percentage of clicks that result in a completed conversion. This is your landing page and offer quality metric. A campaign with excellent CTR can still be deeply unprofitable if the landing page does not convert the traffic it receives.
Formula: (Conversions ÷ Clicks) × 100
What good looks like: 2%–5% is the industry average across most verticals. Top-performing campaigns and landing pages reach 8%–15%. For high-intent, commercial keywords on a well-optimised landing page, anything below 2% warrants a structured CRO audit.
When to act: A Conversion Rate below 1% on commercial keywords almost always indicates a landing page problem — not an ads problem. Check: does the page headline match the ad’s promise? Is there a single, clear call to action? Does the page load in under 3 seconds on mobile?
Cost Per Acquisition (CPA)
What it is: The average amount you spend to generate one conversion. This is the unit economics metric for any campaign. If your CPA exceeds the profit a single customer generates, the campaign is losing money regardless of how good every other metric looks.
Formula: Total Cost ÷ Total Conversions
What good looks like: Entirely business-specific. Set your target CPA as a function of your average order value and gross margin. If your product generates ₹5,000 gross profit per sale, a CPA of ₹1,500 is profitable. A CPA of ₹6,000 is not, regardless of what the industry average says.
When to act: CPA rising above your target threshold over a sustained period requires campaign-level diagnosis: which keywords, ad groups, or audience segments are driving high-CPA conversions? Pause or restructure those segments before cutting budget from the whole campaign.
Return on Ad Spend (ROAS)
What it is: The revenue generated for every rupee spent on Google Ads. ROAS is the closest native Google Ads metric to direct profitability — though it measures revenue, not profit, so it must always be interpreted alongside your margin structure.
Formula: Total Conversion Revenue ÷ Total Ad Spend
What good looks like: A minimum viable ROAS of 3× applies to most businesses with reasonable margins. Our own KashmirTickets.com campaigns consistently run at 4.8× ROAS. E-commerce businesses with thin margins may need 6×–8× to be profitable after cost of goods. Service businesses with high margins may be profitable at 2×.
When to act: ROAS declining below your target threshold should trigger a segmented analysis: which campaigns, products, or audience combinations are dragging the blended ROAS down? Do not cut the whole account — cut the underperforming segments and reinvest in what is working.
Conversion Value
What it is: The total revenue value attributed to your conversions in a given period. Requires that you pass actual transaction values to Google Ads — either through static values per conversion action for lead generation, or dynamic values via your website’s data layer for e-commerce.
Formula: Sum of all conversion values in the period.
When to act: If you are using static conversion values, recalibrate them at least quarterly to ensure they reflect actual average deal or order values. Stale static values will cause Smart Bidding strategies to optimise toward the wrong target.
Conversion Value Per Conversion
What it is: The average revenue value of a single conversion. This metric helps identify which campaigns, ad groups, or keywords are driving high-value conversions versus low-value ones — critical for budget allocation decisions when running multiple campaigns simultaneously.
Formula: Total Conversion Value ÷ Total Conversions
When to act: If two campaigns have similar CPA but very different Value Per Conversion, shift budget toward the higher-value campaign even if its absolute conversion volume is lower.
All Conversions
What it is: A broader conversion count that includes view-through conversions — users who saw your Display or YouTube ad but did not click, then later converted on your site through another channel. Also includes cross-device conversions and store visits where applicable.
When to act: Useful for understanding the full assisted impact of awareness campaigns, but should not replace click-based conversion data for bidding or budget decisions. Keep All Conversions in a secondary column — not in your primary reporting view.
Competitive and Auction Metrics — How Do You Compare?
Auction Insights metrics give you a direct read on how your campaigns perform relative to specific competitors bidding on the same keywords. They are available at the campaign, ad group, and keyword level, and they are invaluable for competitive strategy decisions — knowing whether to increase bids, improve Quality Score, or adjust targeting.
Absolute Top Impression Share
What it is: The percentage of your impressions that appeared in the very first paid position above all organic results — the most prominent slot on a search results page.
Formula: Absolute Top Impressions ÷ Eligible Absolute Top Impressions
What good looks like: 80%–90%+ for branded campaigns. 40%–60% is realistic for competitive non-branded terms depending on budget and Quality Score. Significantly below this on branded terms indicates a competitor is actively bidding on your brand name and winning.
Top Impression Share
What it is: The percentage of your impressions that appeared anywhere above the organic results — positions 1 through 4 of paid ads. Distinct from Absolute Top IS, which is exclusively position 1.
Formula: Top Impressions ÷ Eligible Top Impressions
What good looks like: 65%+ for high-priority commercial keywords. Below 50% on your most valuable terms suggests either bid floors or Quality Score gaps that competitors are exploiting.
Auction Overlap Rate
What it is: How often a specific competitor’s ad appeared in the same auction as yours — meaning you were both eligible to show for the same search at the same time. High overlap rate identifies your primary auction competitors, who may be different from your perceived market competitors.
When to act: Use high-overlap competitors as your primary benchmarks for Quality Score and CTR comparison. If a competitor consistently outranks you despite similar bids, their Quality Score is higher — and that is the gap to close.
Position Above Rate
What it is: How often a specific competitor’s ad showed in a higher position than yours when you both appeared in the same auction. A competitor with a 70% Position Above Rate is outranking you on 7 in 10 shared auctions.
When to act: High competitor Position Above Rate combined with high Lost IS (Rank) confirms a Quality Score or bid problem. If your QS is already strong, a targeted bid increase on those specific keywords may be justified.
Outranking Share
What it is: The inverse of Position Above Rate — how often your ad showed in a higher position than a specific competitor’s, or how often your ad appeared when theirs did not. This tells you where you are winning and who you are already beating.
What good looks like: Above 50% against your primary competitors on your core commercial terms. Below 30% against a specific competitor is worth diagnosing — are they outbidding you, or are they running better Quality Score optimisation?
Advanced Metrics for Scaling Campaigns
Once your campaigns are generating positive ROAS consistently, the focus shifts from stabilisation to scale. These metrics are most relevant at that stage — they help you find new efficiency, expand to new audiences, and prevent the performance degradation that often accompanies aggressive scaling.
Search Terms Report
What it is: Not a single metric, but the most important report in any Search campaign. It shows the exact queries that triggered your ads — which may be very different from the keywords you are bidding on, depending on your match type settings.
When to act: Review weekly. Irrelevant search terms should be added as negative keywords immediately. High-converting search terms not in your keyword list should be added as exact match targets with dedicated ad groups. This single habit prevents a significant portion of wasted spend in any Broad or Phrase match campaign.
Call Conversions
What it is: Conversions generated from phone calls — whether from call extensions shown on the ad, call-only ads, or calls tracked on your website after an ad click. For service businesses, call conversions are frequently more valuable than form submissions and are systematically under-tracked.
Formula: Count of calls meeting your minimum duration threshold (typically 60 seconds).
When to act: If your business receives meaningful inbound call volume, set up Google Forwarding Numbers in your call extensions and enable website call tracking via Google Tag. Without this, your conversion data is significantly incomplete and your bidding strategies are optimising toward an incomplete signal.
Bid Strategy Type
What it is: The active bidding strategy Google is applying to your campaign — Manual CPC, Enhanced CPC, Maximise Clicks, Maximise Conversions, Target CPA, Target ROAS, or Maximise Conversion Value.
What good looks like: Matched to your campaign’s data volume and objective. Smart Bidding strategies such as tCPA and tROAS require a minimum of 30–50 conversions per month in the past 30 days to perform reliably. Below that threshold, Maximise Conversions or Manual CPC prevents the algorithm from making poor decisions on insufficient data.
When to act: If a campaign running tCPA or tROAS is underperforming, check conversion volume before adjusting targets. Switching strategies too frequently resets the learning phase and compounds performance instability.
Optimisation Score
What it is: Google’s 0%–100% rating of how well your account is configured based on its recommendations — bid strategy changes, keyword additions, budget increases, and asset additions.
What good looks like: A useful directional indicator, not an account health absolute. Google’s recommendations are generated in its commercial interest as well as yours. Accepting every recommendation uncritically will often increase spend without a proportional return.
When to act: Review each recommendation on its own merits against your campaign objectives. Accept those that align with your strategy. Dismiss those that do not — dismissed recommendations do not harm your account.
Frequency (Display and YouTube)
What it is: The average number of times a unique user has been shown your ad within a selected period. Relevant exclusively for Display, YouTube, and Demand Gen campaigns where reach and brand recall are objectives.
Formula: Total Impressions ÷ Unique Reach
What good looks like: 3–5 times per user per week for most awareness campaigns. Higher frequency can be justified for remarketing campaigns where repetition reinforces a conversion decision.
When to act: Frequency above 7–10 combined with declining CTR is ad fatigue — users have seen your creative enough times that they have stopped processing it. Introduce new creative variations or apply frequency caps at the campaign level to reset exposure curves.
Quick Reference: All Google Ads Metrics at a Glance
The table below provides a condensed reference for every metric in this guide. For full context on any metric, refer to the relevant section above.
| Metric | Category | Formula | Benchmark | Action Trigger |
|---|---|---|---|---|
| Impressions | Volume | Platform count | Growing W/W | Sudden drop → check disapprovals |
| Clicks | Volume | Platform count | Proportional to IS | High impr., low clicks → fix headlines |
| CTR | Volume | Clicks ÷ Impressions | 3–5% (Search) | <1% → rewrite ad copy |
| Impression Share | Volume | Imp. ÷ Eligible Imp. | 80%+ (branded) | <40% → diagnose budget or rank |
| Lost IS (Budget) | Volume | Google-reported | <10% | >20% → increase budget |
| Lost IS (Rank) | Volume | Google-reported | <10% | High → fix Quality Score first |
| Cost (Spend) | Cost | Sum of charges | Proportional to ROAS | Rising without ROAS improvement → segment |
| CPC | Cost | Cost ÷ Clicks | Industry-specific | Rising + flat conv. rate → check QS |
| CPM | Cost | (Cost ÷ Imp.) × 1,000 | ₹30–₹80 (Display, IN) | Rising → check audience fatigue |
| Quality Score | Quality | 1–10 composite | 7–10 | <5 → full QS audit |
| Expected CTR | Quality | Below / Avg / Above | Above Average | Below → keyword in Headline 1 |
| Ad Relevance | Quality | Below / Avg / Above | Above Average | Below → tighter ad group structure |
| Landing Page Exp. | Quality | Below / Avg / Above | Above Average | Below → match page to ad promise |
| Ad Strength | Quality | Poor → Excellent | Good / Excellent | Poor → diversify headlines |
| Conversions | Conversion | Platform count | Growing M/M | Zero → verify tracking first |
| Conversion Rate | Conversion | Conv. ÷ Clicks | 2–5% | <1% → landing page audit |
| CPA | Conversion | Cost ÷ Conv. | ≤ Gross margin per sale | Above target → segment by keyword |
| ROAS | Conversion | Revenue ÷ Spend | 3×+ minimum viable | Declining → cut underperforming segments |
| Conversion Value | Conversion | Sum of values | Growing M/M | Flat → check value passing setup |
| Abs. Top IS | Competitive | Abs. Top ÷ Eligible | 80%+ (branded) | Low branded → check competitor bidding |
| Overlap Rate | Competitive | Auction Insights | Contextual | High overlap → benchmark QS against them |
| Outranking Share | Competitive | Auction Insights | >50% vs key competitors | <30% → QS or bid gap to close |
| Frequency | Advanced | Imp. ÷ Unique Reach | 3–5/week (awareness) | >7 + falling CTR → refresh creative |
| Optimisation Score | Advanced | 0–100% | Directional only | Evaluate each recommendation individually |
The Metric Hierarchy That Actually Matters
Every metric in this guide serves the campaign. But not all metrics serve the campaign equally. When you are diagnosing a problem or making a budget decision, apply this hierarchy.
Start with Conversion and Revenue metrics. ROAS, CPA, Conversion Rate, and total Conversions tell you whether the campaign is profitable. If these are healthy, everything else is context. If these are broken, everything else is a clue.
Then check Quality metrics. Quality Score, Landing Page Experience, and Ad Relevance explain why your economics look the way they do. A low Conversion Rate almost always points back to a landing page or offer problem. A high CPC almost always points to a low Quality Score.
Then check Volume metrics. Impression Share, Lost IS (Budget), and Lost IS (Rank) tell you whether your campaign has the reach needed to generate the volume of clicks and conversions your business requires. A profitable campaign with 30% Impression Share has significant upside still available.
Use Competitive metrics for strategy. Auction Insights data informs decisions about bid levels and Quality Score investment — not daily optimisation.
Understanding this hierarchy is the difference between a marketer who reacts to every data fluctuation and one who makes deliberate, evidence-based decisions that compound over time. For a broader view of how paid advertising fits into a full-funnel performance strategy, see our guide on integrating SEO, SEM and social for better ROI.
For a deeper understanding of how Google defines and calculates these metrics at the platform level, Google’s own campaign performance data documentation is the authoritative reference — though the strategic interpretation of what to do when those numbers move is a different discipline entirely.
Frequently Asked Questions About Google Ads Metrics
What are the most important Google Ads metrics to track?
The six most important Google Ads metrics are CTR, Quality Score, Conversion Rate, CPA, ROAS, and Impression Share. These six give you a complete read on ad relevance, campaign economics, and competitive positioning simultaneously. Start here before adding any secondary metrics to your reporting dashboard.
What is a good CTR for Google Ads in 2026?
For Google Search Ads, a CTR of 3%–5% is healthy across most industries. Branded campaigns frequently exceed 15%–20%. Display Ads operate on a different scale entirely — a CTR of 0.35%–0.5% is strong. Compare first against your own historical campaign data before using industry averages as a benchmark, since averages blend high-intent and low-intent keywords together.
What is ROAS in Google Ads and what is a good ROAS?
ROAS stands for Return on Ad Spend — the revenue generated for every rupee spent on your Google Ads campaigns. It is calculated by dividing total conversion revenue by total ad spend. A 4× ROAS means every ₹1 spent returned ₹4 in revenue. A minimum viable ROAS of 3× applies to most businesses, but the right target depends on your gross margin. High-margin service businesses may be profitable at 2×. Low-margin e-commerce businesses may need 6×–8× to cover cost of goods.
What does Quality Score mean in Google Ads and why does it matter?
Quality Score is Google’s 1–10 rating of how relevant your keyword, ad copy, and landing page are to the user’s search query. It matters because it directly determines your Ad Rank and your effective CPC. A Quality Score of 8–10 can reduce your cost per click by 30%–50% compared to a score of 3–4 bidding on the same keyword. Improving Quality Score is frequently the highest-ROI action available in any underperforming account.
What is Impression Share in Google Ads?
Impression Share is the percentage of eligible impressions your ads actually received. If your Impression Share is 60%, your ads entered 60 out of every 100 auctions they qualified for. The remaining 40% was lost either to insufficient budget — reported as Lost IS (Budget) — or insufficient Ad Rank — reported as Lost IS (Rank). Google reports both separately so you know exactly where to focus the fix.
How many Google Ads metrics should I track?
For most businesses, a core dashboard of 8–12 metrics is optimal: Impressions, Clicks, CTR, CPC, Quality Score, Conversions, Conversion Rate, CPA, ROAS, and Impression Share with its Budget and Rank sub-metrics. Adding more columns without a corresponding action framework creates analysis paralysis rather than better decisions. Build a compact primary dashboard, then create a secondary diagnostic view for deeper investigation when primary metrics flag a problem.
What should I check first when Google Ads conversions drop suddenly?
In this order: first, verify that conversion tracking is still firing correctly — tag breakage is the most common cause of a sudden conversion drop and is completely invisible in the main metrics view. Second, check whether impression volume has dropped, which would explain lower conversion volume mathematically. Third, check Conversion Rate — if impressions and clicks are stable but conversions have fallen, a landing page change or a seasonal demand shift has altered buyer behaviour. Fourth, check for auction competition changes in the Impression Share report.
What is the difference between CPA and ROAS in Google Ads?
CPA measures what you spend to generate one conversion — it is a cost metric. ROAS measures the revenue returned per rupee spent — it is a revenue metric. For lead generation campaigns where conversions are enquiries rather than purchases, CPA is typically the primary metric. For e-commerce campaigns where conversions carry an actual revenue value, ROAS is the primary metric. Both should be set relative to your margin structure to be operationally meaningful.
The Bottom Line
Google Ads gives you access to more data than any campaign actually needs. The businesses that get the best results from paid search are not the ones who track the most metrics — they are the ones who track the right ones, understand what each is telling them, and act on that information consistently.
Start with the six essentials: CTR, Quality Score, Conversion Rate, CPA, ROAS, and Impression Share. Get those healthy and stable. Then use competitive and advanced metrics to identify where the next increment of performance is hiding.
If your campaigns are not performing to the level your budget warrants, the problem is almost always in one of three places: a Quality Score problem compounding your cost disadvantage, a landing page problem preventing clicks from converting, or a conversion tracking problem preventing your bidding strategy from learning correctly. The metrics in this guide will tell you exactly which one it is.
For more on how we build and manage Google Ads campaigns at Harmukh Technologies, see our Google Ads service page. If you are looking to build your own skills across paid media and performance marketing, our 1-on-1 digital marketing mentorship programme covers Google Ads campaign management as a core module — with real account access, not simulations.
Running Google Ads and not seeing the returns your spend should be generating?
At Harmukh Technologies, we audit Google Ads accounts and identify exactly where budget is being lost — whether that is a Quality Score gap, a tracking failure, a bidding strategy mismatch, or a landing page issue. Get in touch for an honest account assessment with no obligation.